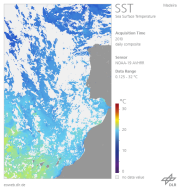
AVHRR - Monthly Sea Surface Temperature (SST) is an AVHRR (Advanced Very High Resolution Radiometer) subset from 1993 to 2014 integrated to facilitate valuable time series exploitation of historic data. This subset represents the Monthly Average of Sea Surface Temperature in degrees celsius, therefore it is possible to display the average temperature by selecting the first day of each month. By two clicks on any pixel, it is possible to display a chart for comparing the temperature in the same area but on different dates.
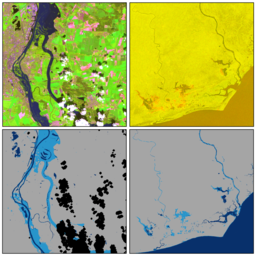
The aim of the “Demand-driven Data Services for Humanitarian Aid” (Data4Human) project was to make geo-information from remote sensing data more usable for humanitarian relief missions and to tailor methods to the needs of humanitarian organizations.
The crevasse dataset provides information on crevasse locations at 0.2 m spatial resolution for selected regions in the Alps. Information on crevasse locations is important for mountaineers and field researchers to plan a safe traverse over a glacier. This dataset is generated based on a multitask deep neural network for automated crevasse mapping from high-resolution airborne remote sensing imagery. The model was trained and evaluated over seven training and six test areas located in the Oetztal and Stubai Alps. By simultaneously preforming edge detection and segmentation tasks, the multitask model is able to robustly detect glacier crevasses of different shapes within different illumination conditions with a balanced accuracy of 86%. To prove large-scale applicability, this dataset includes high-resolution crevasse maps for the entire Oetztal and Stubai Alps based on imagery acquired within the years 2019 and 2020. Furthermore, high-quality crevasse maps for all glaciers surrounding Grossglockner, Piz Palue, and Ortler were generated for available imagery in the years 2022 and 2023, repsectively.
The Global Urban Footprint® (GUF®) dataset is based on the radar (SAR) satellite imagery of the German satellites TerraSAR-X and TanDEM-X. By creating the GUF database, scientists at the German Remote Sensing Data Center (DFD) of the German Aerospace Center (DLR) have succeeded in using a newly developed method to generate a global raster map of the world’s built-up pattern in a so far unprecedented spatial resolution of about 12m per raster cell.
Information about residential heat demand is crucial for sustainable climate mitigation and adaptation as approximately 30% of the heat demand stem from residential heating which contribute to one third of the nationwide CO2 emissions. This service provides information on heat demand in kWh/a based on three different refurbishment scenarios (no refurbishment, advanced refurbishment, usual refurbishment).
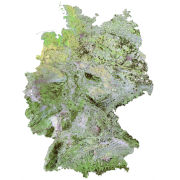
The Soil Composite Mapping Processor (SCMaP) is a new approach designed to make use of per-pixel compositing to overcome the issue of limited soil exposure due to vegetation. Primary products are reflectance composites that will allow for a long term assessment of exposed soils. Further products include the distribution of exposed soils and statistical information related to soil use and intensity. The resulting reflectance soil composites correlate well with existing soil maps and the underlying geological structure.
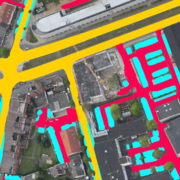
This inventory of traffic areas in the city of Brunswick, Germany, is based on image sequences acquired during six flight campaigns at different times of the day and year in 2019 and 2020.
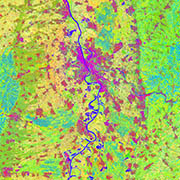
The TimeScan product is based on the fully-automated analysis of comprehensive time-series acquisitions of Landsat data. Based on a user-specified definition of the required period of time, the region of interest and – optionally – the maximum cloud cover, the TimeScan processor starts with the collection of all available Landsat scenes that meet the user specification. Next, for each single scene masking of clouds, haze and shadow is conducted using the Fmask algorithm. Then, a total of 6 indices is calculated for those pixels of each single scene that have not been masked in the prior step. The set of indices includes the Normalized Difference Vegetation Index (NDVI), the Built-up Index (BI), the Modified Normalized Difference Water Index (MNDWI), the Normalized Difference Band-5 / Band-7 (ND57), the Normalized Difference Band-4 / Band-3 (ND43), and the Normalized Difference Band-3 / Band-2 (ND32). Finally, the TimeScan product is generated by calculating the temporal statistics (minimum, maximum, mean, standard deviation, mean slope) for each index over the defined period of time. Hence, in case of the defined 6 indices chosen, the TimeScan product will include a total of 30 bands (5 statistical features per index). As an additional band a quality layer is added which shows for each pixel the number of valid values (meaning times with no cloud/haze or shadow cover) that have been included in the statistics calculation.