This page lists the latest Geoservice news, changes and status of services and datasets. These announcements are also available as a RSS news feed.
Nov 21, 2024
New data sets from earth observation show the diversity and utilisation of agricultural land [1]. This raster dataset depicts the main type of crop grown on each field in Germany each year. Crop types and crop rotation are of great economic importance and have a strong influence on the functions of arable land and ecology.
Based on Sentinel-1 and Sentinel-2 time series as well as LPIS data from some Federal States of Germany, 18 different crops or crop groups were mapped per pixel with 10 m resolution for Germany on an annual basis since 2018.
A full description of the method and results can be found in the publication [2].
The datasets will also be available for download soon.
Sep 13, 2024
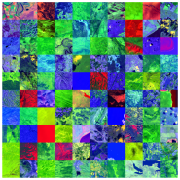
Based on the EnMAP L2A data collection [1], a 3.3 terabytes dataset of over half a million hyperspectral image patches of size 128x128 pixels and 202 channels has been assembled: ″SpectralEarth″ [2] aims to share a valuable asset for the training of hyperspectral foundation models and self-supervised machine learning algorithms. To that end, SpectralEarth ships with a subset of annotations for various land cover classification tasks.
The data can be downloaded directly from the EOC Download Service. [3]
Further information on the data can be found in the publication. [4]
We are pleased to inform you that our service has been updated with a new design. We have revised the structure of the site to offer you an enhanced user experience. The new design of the "Datasets" optimizes the overview of available data [1].
The most important changes include:
We hope you like the new design and that it makes it easier for you to work with our service.
If you have any questions or feedback, please do not hesitate to contact us.
Best regards
Your EOC Geoservice Team.
The forest structure product for Germany consists of the attributes canopy height [1], total canopy cover [2] and above-ground biomass density (AGBD, [3]) as annual products from 2017 to 2022 in 10 m spatial resolution. The products were generated using a machine learning modelling approach that combines complementary spaceborne remote sensing sensors, namely GEDI (Global Ecosystem Dynamics Investigation; NASA; full-waveform LiDAR; [4]), Sentinel-1 (Synthetic-Aperture-Radar; ESA; C-band; [5]) and Sentinel-2 (Multispectral Instrument; ESA; VIS-NIR-SWIR; [6]). The derived products are the first consistent data sets on canopy height, total canopy cover and AGBD for Germany which enable a quantitative assessment of recent forest structure dynamics, e.g. in the context of repeated drought events since 2018. The full description of the method and results can be found in the publication of Kacic et al. 2023 ([7]).
The data will be accessible through the EOC Geoservice WMS [8] and can be downloaded directly from the EOC Download Service. [9]
The 30m TanDEM-X products depict detailed information of the topographic height and changes over a certain time. The DEM Change Maps [1] focus on the changes that have occurred during the years separating this new coverage from the coverages acquired to generate the TanDEM-X global DEM (between 2011 and 2014). The Change Maps are available in 30m posting and show height differences between the edited first global TanDEM-X DEM and the newly acquired time-tagged DEM scenes. The TanDEM-X 30m Edited DEM [2] is a product variant of the Global Digital Elevation Model (DEM) acquired in the frame of the German TanDEM-X mission between 2010 and 2014, and has a reduced pixel spacing of 1 arcseconds (arsec), which corresponds to 30m at the equator.
The data will be accessible through the EOC Geoservice WMS and can be downloaded directly from the EOC Download Service. [3] [4]
Further information on the products can be found in the Data Guide. [5]
Oct 20, 2023
The EnMAP HSI L2A STAC Collection [1] expands the accessibility of EnMAP with a standardized dataset series particularly for users of Big Data or time series analysis. The dataset provided will contain the entire mission data processed with the latest atmospheric correction methodology of the land processor to Level 2A. In addition, the data will be Analysis Ready Data (ARD) and the metadata will follow the CEOS Analysis Ready Data (CEOS-ARD) [2] framework. The data will be accessible through the EOC Geoservice STAC endpoint [3] or can be downloaded directly from the EOC Download Service [4]. The collection will contain all "overallQuality" levels, unlike the collections in EOWEB [5]. At the moment, the data is still being reprocessed, so the collection will continue to fill up in the near future.
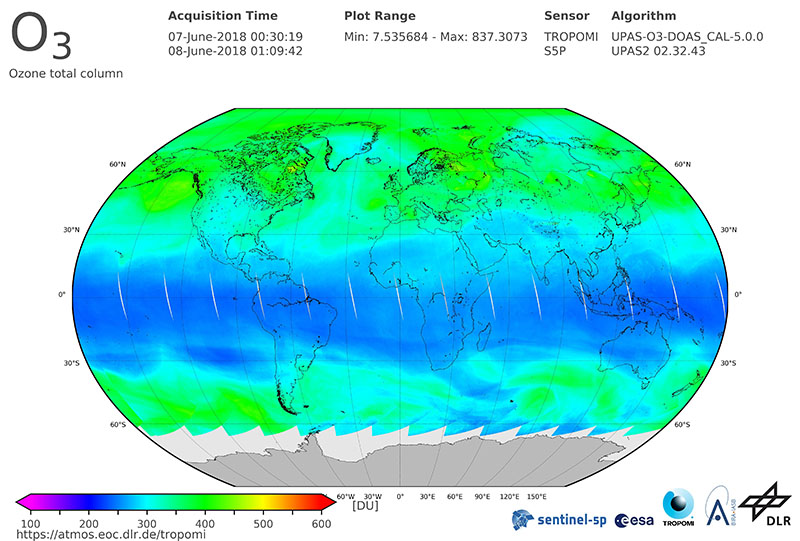
Since August 1, 2023, the Sentinel-5P L3 datasets are being generated with the new UMAS: 4.1.0 processor. These products are being published via our STAC Catalog endpoint [9]. At current (06.09.2023) these atmospheric trace gases and cloud physical parameters are being produced as Level 3 products: Ozone, Formaldehyde, Sulphur Dioxide, Cloud Fraction, Cloud Optical Thickness and Cloud Top Height. These improved UMAS-4 L3-products are now available in the Web Mapping Service (WMS) [7]. However, "old" products (generated with previous versions of UMAS) are still available in the download service [2]. This applies for data (from January 16, 2022 until July 31, 2023). In the upcoming months all Level 3 products from mission start onwards will be reprocessed with UMAS-4 and published via this platform. For the whole period, additional S5P L3 products will follow soon.
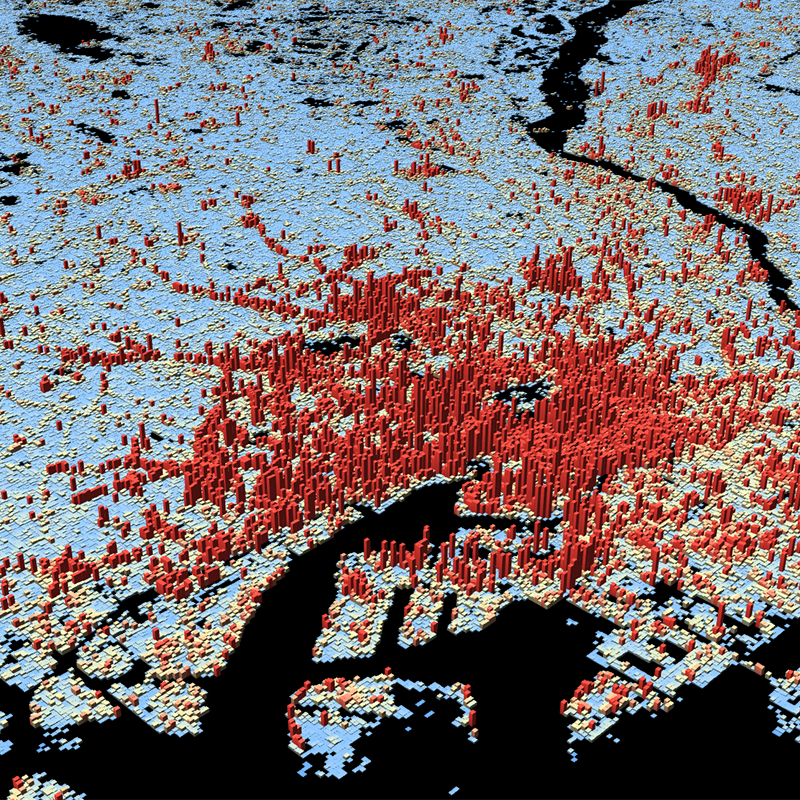
The World Settlement Footprint (WSF) 3D datasets provide detailed quantification of the average height, total volume, total area and the fraction of buildings at 90 m resolution at a global scale. It is generated using a modified version of the World Settlement Footprint human settlements mask derived from Sentinel-1 and Sentinel-2 satellite imagery in combination with digital elevation data and radar imagery collected by the TanDEM-X mission. [1]. In addition to the 2D view in the WMS, the data is also accessible to the user in a 3D view. It is a derivative of the WSF3D raster dataset tailored for the web. As a tiled vector dataset, it enables dynamic client-side visualization of the WSF3D metrics. The WSF 3D datasets can be explored via EOC GeoService Webappp [2], via the 3D Viewer [3] or can be downloaded directly from the EOC Download Service [4].
Sep 14, 2022
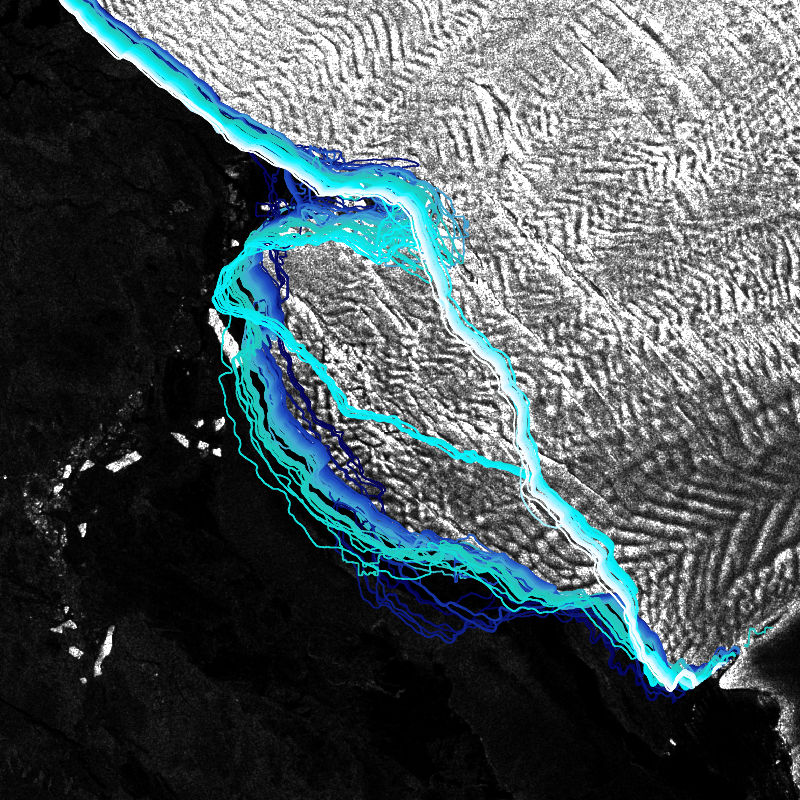
The IceLines dataset provides information on Antarctic ice shelf front dynamics. This allows conclusions on iceberg calving mechanisms and to observe changes in the Antarctic coastline. On the basis of Sentinel-1 data, the fronts of the largest ice shelves of Antarctica are continuously mapped with a deep learning approach (HED-Unet) [1] [2]. The generated dataset includes front positions for 36 ice shelves with a daily, monthly, seasonal and annual temporal resolution since the launch of Sentinel-1 in 2014. IceLines is updated on a monthly basis and can be explored via the EOC GeoService Webapp [3] or directly downloaded from the EOC Download Service [4]. Further information on the product is available on a separate DLR website [5].
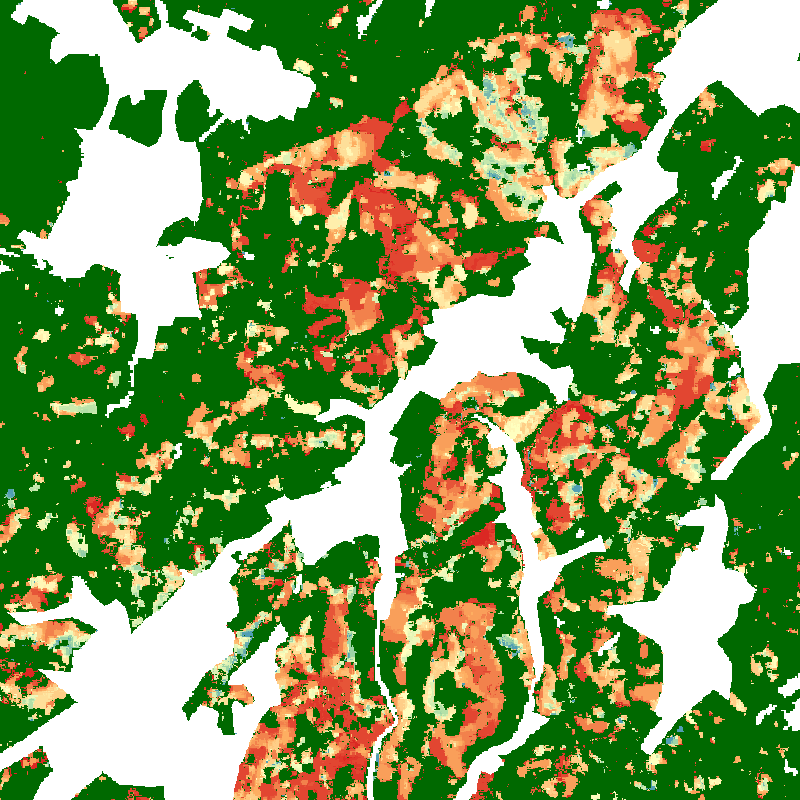
The product shows monthly tree canopy cover loss information between January 2018 and April 2021 for Germany. The dataset is based on image composites of the disturbance index (DI) derived from Sentinel-2 and Landsat-8 time series. In addition, different maps of tree canopy cover loss in Germany per district (Landkreis) are available depicting the losses for different forest types in absolute numbers and in percentages.
The datasets are now available in the EOC Geoservice Webapp [1] and can also be downloaded from the EOC Download Service [2]. Further information on the product is available on the DLR news website [3].